


INTRODUCTION
The brainstem consist of the midbrain, the pons, and the medullar oblongata, located in the posterior part of the brain1). The brainstem is a unique structure and has the crucial connection among the cerebrum, the cerebellum and the spinal cord. The brainstem is responsible for multiple critical functions, including blood pressure, heart rate, respiration and awakeness2). The cranial nerve nuclei that are located in the brainstem have a crucial role in balance, hearing, swallowing, speech, motor and sensory. In other words, brainstem injury can result in various symptoms like cardiac and respiratory dysfunction, facial palsy, dysarthria, vision abnormality, decreased consciousness and even death. Hence early diagnosis and appropriate management of brainstem injury is the key factor to reduce morbidity and mortality.
Hemorrhagic stroke is a disastrous cerebrovascular disease associated with a vast degree of morbidity and mortality3). Among these, intracerebral hemorrhage (ICH) accounts for 10-28% of stroke worldwide and results in very high mortality and morbidity rates that have not changed for more than decades4).
Pontine hemorrhage accounts for approximately 10% of all ICH5), and its outcome is closely related to the recovery of consciousness, motor function, and respiratory drive as the cranial nerves V to VIII originate from the pons6). These patients usually have very poor prognosis with overall mortality rates of 30-50%3). Despite these high mortality rates, most of pontine hemorrhage patients are treated conservatively.6 For primary hemorrhage originate from the posterior fossa, the American Stroke Association Guidelines recommend considering the surgical removal of cerebellar hematoma, but not the brainstem hematoma7). The guideline recommends against the surgical evacuation of brainstem hematoma for poor clinical outcome. Hence, it is difficult to treat and predict the outcome of brainstem hemorrhage patients.
Several studies have attempted to predict prognosis in patients with pontine hemorrhage, although many predictors based on clinical and radiological features have been identified in conservative patients6,8). Previous studies have found that brainstem volume is similar in adult patients, regardless of age9), and the greater hemorrhage volume is associated with reduced consciousness and worse prognosis, regardless of age or sex6,8,10,11). Few reports have revealed an association between prognosis and bleeding location5,12-18). These reports show large variation in survival and functional recovery rates.
In the present study, we exclusively developed a pontine hemorrhage measurement model using an axial cut in a simple, 5-mm computed tomography (CT) scan. We hypothesized that prognosis in patients with pontine hemorrhage could be predicted by schematically illustrating the hemorrhageŌĆÖs volume and location. On this basis, we developed a scoring model to predict the relationship between initial pontine hemorrhage characteristics and clinical outcome. To the best of our knowledge, no report has focused on the association between the volume and location of pontine hemorrhage with patientŌĆÖs clinical outcome.
MATERIALS AND METHODS
Appropriate institutional review board approval and patient consent were obtained for this study. The data that support the findings of this study are available from the corresponding author upon reasonable request.
Study Design and Participants
This is a retrospective and multicenter study conducted in different Korean neuro-intensive care units (ICU)s between January 2010 and December 2019. Only patients aged over 18 years were included in the study. The following are criteria for inclusion of patients in our study: 1) diagnosis of pontine ICH based on CT including hypertensive, vascular abnormality (arteriovenous malformation [AVM], cavernous malformation [CM], or malignancy bleeding, 2) age Ōēź18 or Ōēż 80 years; and 3) expectation of staying in the ICU Ōēź 48 hours. The exclusion criteria were as follows: (1) any evidence of traumatic brain injury, (2) loss to follow-up before 24-months post-hemorrhage (3) pregnancy, (4) post-cardiac arrest with the diagnosis of severe hypoxic brain injury, and (5) do not resuscitate ordered patients. The relevant data were obtained from the medical records by a physician and trained research nurse. The following candidate factors were analyzed: (1) age, (2) sex, (3) comorbidities, namely hypertension (previous diagnosis or prescription of relevant medication), diabetes mellitus (previous diagnosis or prescription of relevant medication), end-stage renal disease (prior diagnosis of chronic kidney disease or regular hemodialysis), the vascular abnormality (AVM, CM or etc.), malignancy bleeding, previous cancer history, (4) hemorrhage date, and (5) use of anticoagulants or antiplatelets (Table 1).
Radiologic Evaluation
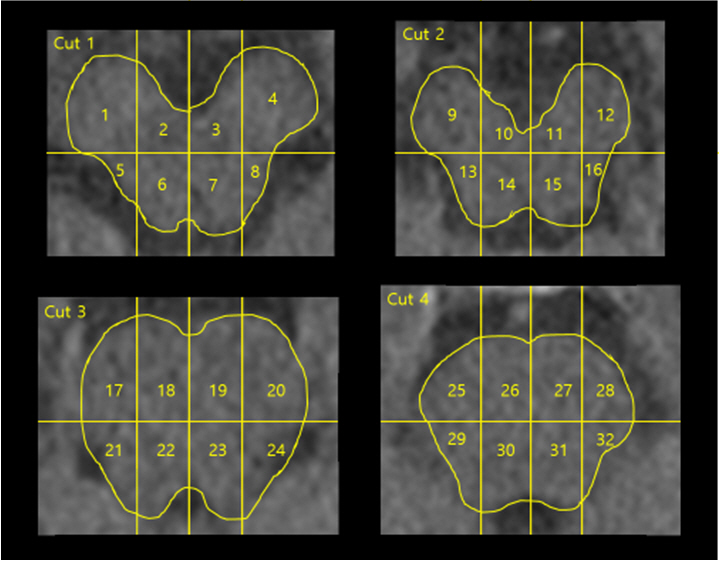
The diagnosis of ICH was assessed based on CT scans. The volume of the brainstem in males and females does not differ significantly among various age groups9). Accordingly, we developed a scoring model using a CT scan (5-mm thin section) (Fig. 1). In this model, we defined a single cell as a hemorrhage volume of 0.5 cm3 (8 ├Ś 7.5 ├Ś 5 mm). All hemorrhages were classified as mild (0.5ŌĆō5 cm3; 1ŌĆō10 colored cells), moderate (5ŌĆō10 cm3; 11ŌĆō20 colored cells), or severe (10ŌĆō16 cm3; 21ŌĆō32 colored cells). All patientsŌĆÖ schematic data, and each cell was numbered and converted into data. In the location analysis, cells numbered 1ŌĆō4, 9ŌĆō12, 17ŌĆō20, or 25ŌĆō28 were classified as anterior, while all others were defined as posterior. Cells numbered 1ŌĆō16 were classified as midbrain, while all others were defined as pontine. The volume of hemorrhage was measured with CT using 1.5 to 5 mm-thick slices; the slices were processed using software developed in-house [AsanJ, based on a plug-in package ImageJ (https://rsbweb.nih.gov/ij)]. To minimize measurement errors, the hemorrhage measurements were performed by two board-certified neurosurgeons who were blinded to treatment assignment and the mean value was documented.
Assessment and Follow-up
All patients were assessed using the Glasgow Coma Scale (GCS), Eastern Cooperative Oncology Group performance status (ECOG), and modified Rankin Scale (mRS) at 0, 6, 12, and 24 months from the bleeding date. If not possible, patient evaluation was performed via the telephone interview by a nurse or doctor not involved in the study and patientŌĆÖs management. The primary outcome was to evaluate the clinical relationship between the hemorrhage volume, location with our assessment tools on different time intervals.
Statistical Analysis
All data were summarized as mean ┬▒ standard deviation for continuous variables and frequency and percentage for categorical variables. Hemorrhage volume groups were compared using either the chi-squared or FisherŌĆÖs exact test for categorical data, and either analysis of variance or the KruskalŌĆōWallis test for continuous variables. To analyze longitudinally measured outcomes, such as GCS, ECOG, and mRS, a linear mixed model was applied to the evaluated group; least square mean, and standard error were used to evaluate time effect, as well as how group and time interacted with outcomes. Crude CoxŌĆÖs proportional hazard model was used to evaluate how hemorrhage volume and location were associated with death, while CoxŌĆÖs proportional hazard model was applied for multivariable adjustments. Statistical analysis was carried out using SAS 9.4 (SAS Institute, Cary, NC). A p-value < 0.05 was deemed statistically significant.
RESULTS
We retrospectively screened 190 hemorrhagic stroke patients who were admitted to ICU between January 2010 and December 2019. After inclusion and exclusion criteria were applied, we retrospectively identified 101 patients. There were no significant differences in baseline characteristics between the patients with different hemorrhage volumes except the blood sugar level at admission (Table 1). The mean age for the mild, moderate and severe groups were 56.4┬▒12.4, 59.9┬▒11.7, 59.4┬▒17.6 years, respectively. All groups showed male predominance (p=0.0435). The most common comorbidities were hypertension (Mild 70.5% vs. Moderate 50% vs. Severe 66.7%, p=0.1685) and diabetes (Mild 13.1% % vs. Moderate 14.3% vs. Severe 33.3%, p=0.2110). Previous administration of antiplatelet or anticoagulant showed no significant differences between the three groups (Mild 9.8% vs. Moderate 17.9% vs. Severe 25%, p=0.2244). The results are summarized in Table 1.
The significant relationship between the neurological outcomes and hemorrhage volume was observed (Table 2; Fig. 2). On admission GCS was significantly different among 3 groups (Mild 11.36┬▒0.47 vs. Moderate 4.68┬▒0.69 vs. Severe 3.08┬▒1.05, p<0.0001). GCS evaluated 3-month after the hemorrhage showed similar results; Mild 12.54┬▒0.41 vs. Moderate 6.16┬▒0.72, p<0.0001. No significant differences were observed on 12 and 24-month GCS evaluation. Severe group patients were not included in the 6, 12 and 24-month evaluation as no patients survived at this time interval. The significant difference was observed comparing the admission and 24-month GCS improvement (Mild 1.53┬▒0.58 vs. Moderate 2.64┬▒1.94, p=0.0001). Similar findings were observed for the clinical outcomes using ECOG and mRS.
Unlike the strong association between the hemorrhage volume and the neurological outcome, significant association was only observed on only time effect assessment in the hemorrhage location analysis (Table 3). When the location was dichotomized into anterior and posterior, mild (p=0.0277) and moderate (p=0.0002) groups showed significant differences at time effect. No other significant findings were observed on group effect, interaction of group & time, group comparisons at a specific time point 0 and 0 vs 24 months. Similar findings were observed when the hemorrhage locations were dichotomized into upper and lower pontine locations. The significant association was only observed on only time effect in the mRS for mild (p=0.0459) and moderate (p=0.0025) groups. No other significant findings were observed on any other effect and group comparisons. Severe group patients (n=5) were not included in the location analysis as there were too small number of patients to perform statistical analysis.
In terms of life expectancy, a significant difference was found depending on the location and volume of pontine hemorrhage (Table 4; Fig. 2). Larger pontine hemorrhage was related to shorter life expectancy. The 24-month follow-up mortality rates in the mild, moderate, and severe groups were 32.79%, 89.29%, and 100%, respectively (p < 0.0001). In the location analysis, there was a positive correlation between anterior pontine bleeding volume and shortened survival time. In the multivariable-adjusted analysis, the anterior and posterior hemorrhage group had 69.44% and 42.86% mortality rates, respectively, after adjustment for hemorrhage volume (p = 0.0020) (Fig. 2). In the midbrain and pontine groups, the mortality rates were 57.14% and 52.94%, respectively. The hazard ratio (HR) was high (HR = 1.518), but no significant results were obtained (p = 0.5867) because the midbrain hemorrhage group had only four patients.
DISCUSSION
Spontaneous pontine hemorrhage is becoming more common and has a significant impact on the physical, psychological, and social well-being of patients and their families. Some patients recover neurologically, while others have a poor neurological prognosis5,11,12,19). In general, posterior pontine hemorrhage has a poorer prognosis than anterior18), but few studies have investigated this difference, and the present study showed contradictory results in this regard.
We decided to use a simple schematic tool to quantify pontine hemorrhage. Human brainstem volume is almost constant in males and females, at about 18.99 ┬▒ 2.36 cm3 and 22.05 ┬▒ 4.01 cm3, respectively. Moreover, it does not differ significantly with age9). Therefore, the number of 5-mm brainstem cuts seen in an axial CT scan is probably constant. We schematically illustrated pontine hemorrhage using axial CT images, in which the midbrain was completely separated from the thalamus and surrounded by the ambient cistern.
Several papers have described the relationship between location and volume of brainstem hemorrhage11,12,18,20-23), but most drew no schematic conclusion about the location of pontine bleeding. Many investigations have predicted that only initial consciousness, measured using the GCS, has any significant effect on prognosis. The prognosis of dorsal pontine hemorrhage is poor in horizontal brainstem structures such as the tectum. However, the schematic tool used in the present article is very intuitive and could be used to distinguish between the upper and lower pons, as well as to identify the hemorrhage location using only a CT scan easily.
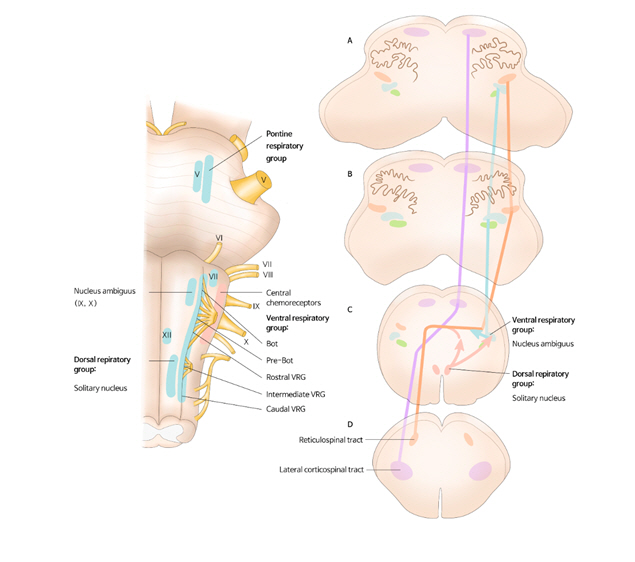
Our study had some limitations. Referral bias cannot be excluded as all participating centers were large, university-affiliated, tertiary care institutions. Consequently, our prediction tool may not represent the general population. Furthermore, the mRS does not accurately reflect neurological improvement or deterioration. As the mRS increases from 1 to 5, the patientŌĆÖs neurological condition worsens. However, a patient with 6 points on the mRS is considered dead, and it is impossible to determine whether their mortality was neurological in origin. Many pontine hemorrhages result in decreased consciousness and high mortality in the acute period because obstructive hydrocephalus leads to chemoreceptor injury and direct brainstem compression8,18,23). Another limitation of the present study was that bleeding was only measured in the upper pons. There are three crucial brainstem respiratory centers: the pneumotaxic center or pontine respiratory group in the dorsal lateral pons, the dorsal respiratory group, and the ventral respiratory group (Fig. 3)24-26). In the brainstem as a whole, the respiratory center is mainly in the rear, but it is concentrated in the front in the upper pons. In the present study, only upper pontine hemorrhage was analyzed, that is, from the midbrain to the point 2 cm lower. Therefore, the respiratory center would have been damaged in the group with a large volume of anterior pontine bleeding, and the respiratory tract was likely damaged in this group, influencing mortality. The correlation between location and prognosis in brainstem hemorrhage could be further studied in an analysis that included the pons and medulla.
Previous studies analyzing the prognosis of brainstem hemorrhage have been limited because they only analyzed the midbrain, pons, and medulla. However, in the present study, a more accurate bleeding-location relationship was confirmed using the intuitive schematic tool, which could subdivide the brain region. From this point of view, our study complemented previous papersŌĆÖ shortcomings and helped extend the data range.
CONCLUSION
According to our prediction model, the initial volume of pontine hemorrhage was most significantly related to neurological outcomes in the mild hemorrhage group. Hemorrhage location showed no relationship with neurological outcome. However, a positive correlation was observed between anterior upper pontine hemorrhage volume and shortened survival time. If the range of research data is extended from the lower pons to the medulla, the brainstem position with the most fatal prognosis could be evaluated using a simple CT scan.