The Prognostic Value of Optic Nerve Sheath Diameter in Patients with Poor-Grade Subarachnoid Hemorrhages
Article information
Abstract
Objective
We evaluated if the optic nerve sheath diameter (ONSD) on brain computed tomography (CT) could be used to predict neurological outcomes of patients with poor-grade subarachnoid hemorrhage (SAH).
Methods
This was a retrospective and observational study of adult patients with poor-grade SAH admitted January 2012 through June 2017. Initial brain CT was performed within 12 hours from onset of SAH. Follow-up brain CT was performed within 48 hours from onset of SAH and after aneurysmal treatment. The primary outcome was neurological status upon six months later assessed with Glasgow Outcome Scale (GOS, 1 to 5).
Results
Among 59 patients with poor-grade SAH, survival to discharge was identified in 47 (79.7%) patients. Of these 47 survivors, 39 (66.1%) had good neurological outcomes (GOS of 3, 4 or 5). In this study, initial ONSDs and follow-up ONSDs in the poor neurological outcome group were significantly greater than those in the good neurological outcome group (all p<0.03). The intracranial pressure (ICP) was monitored in only 13 (22.0%) patients at that time of follow-CT scanning. Using simple correlation analysis, there was a linear correlation between ONSD and ICP (ρ=0.683, p=0.010). In ROC curve analysis for prediction of poor neurological outcome, ONSDs and ONSD indices had considerable predictive values (C-statistics: 0.683 to 0.804) and similar predictive performances for poor neurological outcome.
Conclusion
The ONSDs and ONSD indices measured on CT scanning may be beneficial for predicting neurological outcomes in patients with poor-grade SAH.
INTRODUCTION
Subarachnoid hemorrhage (SAH) is a complex neurovascular syndrome and a devastating condition with high mortality and morbidity rates for those that survive the initial hemorrhage2,6,8). In SAH patients, the level of consciousness on admission is the most critical early predictor of clinical outcome2). Patients with poor-grade SAH (World Federation of Neurosurgeons [WFNS] grade 4 and 5) could have high mortality and poor neurological outcome13). However, there are recent reports on patients with poor-grade SAH treated early and aggressively with coil embolization and neurointensive care could achieve a good neurological outcome6,13). Therefore, to accurately evaluate the prognosis of these patients, new predictors other than the initial level of consciousness are needed.
Poor neurological outcome is usually secondary to early brain injury or delayed cerebral ischemia in SAH patients2). Uncontrolled intracranial hypertension results in decreased cerebral perfusion and transient global cerebral ischemia2,5). Therefore, early monitoring of intracranial hypertension may be beneficial in predicting neurological outcomes of the patients with poor-grade SAH.
Measurement of optic nerve sheath diameter (ONSD) has been proposed as an alternative method for detection of intracranial hypertension4,11). However, if ONSD may be beneficial to systemically estimate neurological outcomes of patients with poor-grade SAH has not been reported. Therefore, the objective of this study is to investigate if the ONSD with some modifications could be used to predict neurological outcomes of patients with poor-grade SAH.
MATERIALS AND METHODS
Study population
This was a retrospective, single-center, and observational study of adult patients with poor-grade SAH admitted to the neurosurgical intensive care unit at Samsung Medical Center January 2012 through June 2017. This study was approved by the Institutional Review Board of Samsung Medical Center (SMC 2018-07-154). The requirement for informed consent was waived due to its retrospective nature. Clinical and laboratory data were collected by a trained study coordinator using a standardized case report form. We included patients with SAH admitted to the neurosurgical intensive care unit during the study period. Those that were obtunded or unconscious (a score of ≤12 on the Glasgow Coma Scale) on admission to the hospital and those given brain computed tomography (CT) scan within 12 hours from onset of SAH were selected. Those given follow-up brain CT scan were performed after treatment of ruptured aneurysm. Of these patients, we excluded patients under age 18, those with malignancy whose expected life span was less than one year, those with insufficient medical records, those with a history of head trauma, neurosurgery, cardiac arrest, or chronic neurological abnormality on admission, and those that transferred from other hospitals after more than one day of onset of SAH. In addition, we excluded patients with anomaly of orbits, orbital mass lesions, and ocular or retro-orbital injury. A total of 59 patients with poor-grade SAH were analyzed in this study (Fig. 1).

Study flow chart. SAH : subarachnoid hemorrhage, GCS : Glasgow Coma Scale, CT : computed tomography, GOS : Glasgow Outcome Scale.
Definitions and outcomes
In this study, poor-grade SAH was defined as World Federation of Neurosurgical Societies (WFNS) grade 4 and 52). The primary outcome was neurological status upon six months later assessed with Glasgow Outcome Scale (GOS, 1 to 5)11). GOSs of 3, 4, and 5 were classified as good neurological outcomes. GOSs of 1 and 2 were considered poor neurological outcomes. We thoroughly reviewed medical records. Patients were graded on the GOS by two independent neurologists. Initial brain CT angiography was performed within 12 hours from onset of SAH. Follow-up brain CT was performed within 12-48 hours from onset of SAH and after aneurysmal treatment. If aneurysmal treatment was not possible, a follow-up brain CT scan was performed within 48 hours. For all CT studies, 64-channel scanners (Light Speed VCT; GE Healthcare, Milwaukee, Wisconsin, USA) with a 5-mm slice width were used. Brain CT images were reviewed by two independent neurologists. Investigators blinded to clinical information opened these CT scans for each patient using commercial image-viewing software (Centricity RA1000 PACS Viewer; GE Healthcare, Milwaukee, Wisconsin, USA). Optic nerve sheath diameter (ONSD) and eyeball transverse diameter (ETD) were measured using the same initial CT scan and subsequent scan. ONSD was measured at a distance of 3 mm behind the eyeball, immediately below the sclera in a perpendicular vector in reference to the linear axis of the nerve (Fig. 2A)4,7,11). The images were changed to the ‘chest/abdomen’ window (window width 300 & window level 10) and were magnified threefold on the particular image slice that demonstrated the largest diameter of the optic nerve sheath11). ONSD was measured from one side of the optic nerve sheath to the other as a section through the center of the optic nerve7). The transverse diameter of the eyeball was chosen because the ONSD is usually measured in the transverse plain 15). ETD was defined as the maximal transverse diameter of the eyeball measured from one side of the retina to the other (in-to-in, Fig. 2B)1,15). The ONSD/ETD index was defined as multiplied median ETD (22.5 mm) by average value of bilateral ONSDs over average value of bilateral ETDs (22.5× ONSDaverage/ETDaverage). The intracranial pressure (ICP) at that time of follow-up CT scanning was defined as immediately measured ICP after the CT scanning.
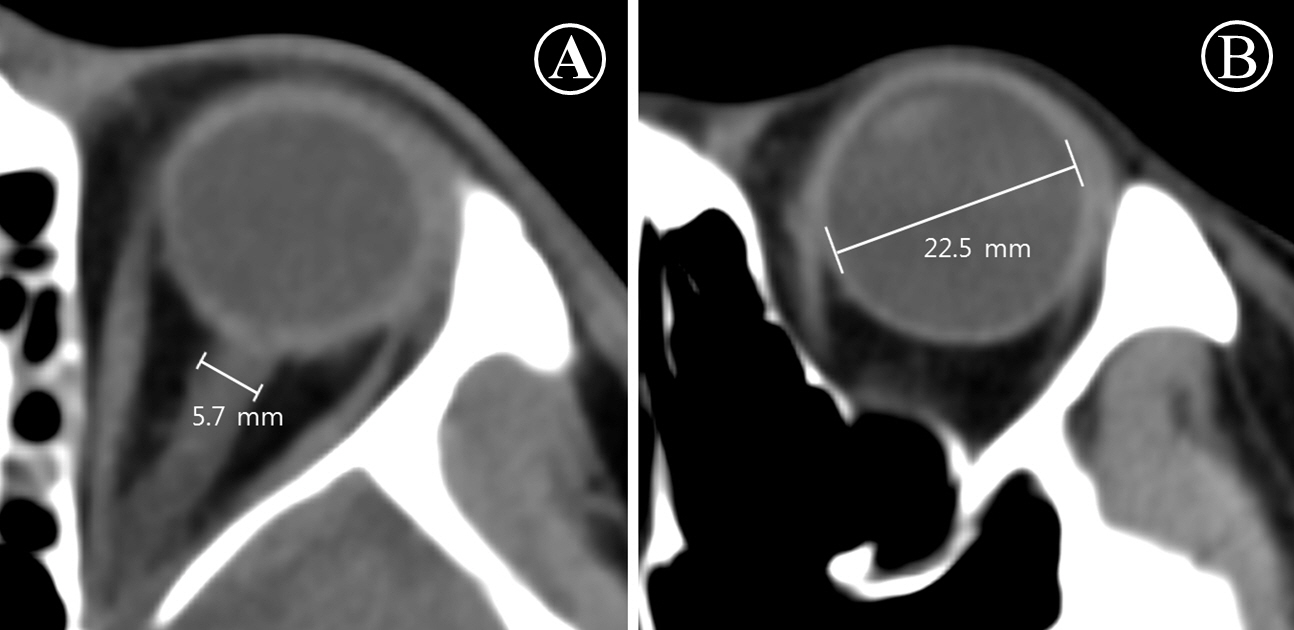
A: Measurement of optic nerve sheath diameter and B : eyeball transverse diameter on the brain computed tomography scan.
Statistical analyses
All data are presented as medians and interquartile ranges (IQRs) for continuous variables and numbers (percentages) for categorical variables. Data were compared using Mann-Whitney U test for continuous variables and Chi-square test or Fisher’s exact test for categorical variables. Simple linear regression was used to plot the relationship between simultaneously measured ONSD and ICP. Spearman's rank correlation coefficient (ρ) was calculated to evaluate correlation between ONSD and ICP. Predictive performances of ONSDs and ONSD indices were assessed using area under the curve (AUC) of the receiver operating characteristic (ROC) curves for sensitivity vs. 1-specificity. AUCs were compared using the nonparametric approach published by DeLong et al.3) for two correlated AUCs. Optimal cut-off value of each ONSD and its modification for predicting poor neurological outcome was obtained by ROC curve and Youden index9,10). All tests were two-sided and p values < 0.05 were statistically significant. Data were analyzed using IBM SPSS statistics version 20 (IBM, Armonk, NY, USA).
RESULTS
Baseline characteristics and clinical outcomes
The median age of patients was 64 (IQR: 53-73 years). Of 59 patients, 18 (30.5%) were males. Hypertension (45.8%) and smoking (18.6%) were most common comorbidities among poor-grade SAH patients. Thirty-five (59.3%) patients were Hunt and Hess grade 5 and 32 (54.2%) patients were WFNS grade 5. Forty-two (71.2%) patients had ruptured aneurysms of anterior circulation. Around middle cerebral artery (27.1%) and anterior communicating artery (20.3%) were most common location of ruptured aneurysm. However, aneurysm or ruptured aneurysm was not detected in four patients (6.8%). Treatment of ruptured aneurysm was performed within 72 hours in most patients (83.1%). Endovascular coiling of the ruptured aneurysm was performed in 36 (61.0%) patients. Surgical clipping was performed in 12 (20.3%) patients. Delayed cerebral ischemia accompanied in 16 (27.1%) patients. Baseline characteristics of SAH patients are presented in Table 1. Survival to discharge was identified in 47 (79.7%) patients. Of these 47 survivors, 39 (66.1%) had good neurological outcomes (GOS of 3, 4 or 5, Fig. 1).
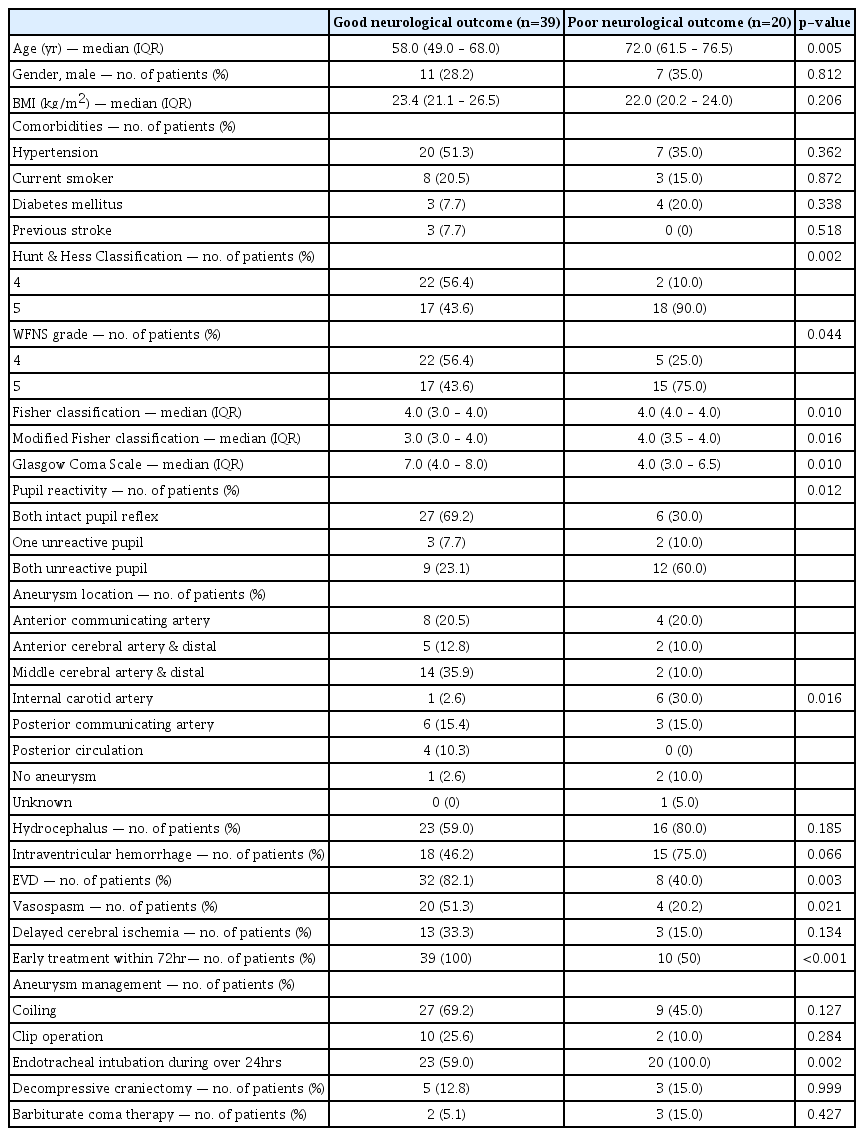
Baseline characteristics
Optic nerve sheath diameters and their modifications
In this study, initial ONSDs and follow-up ONSDs in the poor neurological outcome group were significantly greater than those in the good neurological outcome group (Table 2). However, initial ETD and follow-up ETD were not significant differences between the good neurological outcome group and poor neurological outcome group (p=0.227 and p=0.108, respectively). The ICP was monitored in only 13 (22.0%) patients at that time of follow-CT scanning. Using simple correlation analysis, there was linear correlation between ONSD and ICP (ρ=0.683, p=0.010) (Fig. 3). In ROC curve analysis for prediction of poor neurological outcome (Fig. 4), the C-statistic of initial ONSDmax was 0.729 (95% CI: 0.583 to 0.875). A cut-off > 6.33 mm had a sensitivity of 80.0% (95% CI: 56.3% to 94.3%) and a specificity of 69.2% (95% CI: 52.4% to 83.0%). The C-statistic of follow-up ONSDaverage was 0.760 (95% CI: 0.633 to 0.887). A cut-off > 6.26 mm had a sensitivity of 70.0% (95% CI: 45.7% to 88.1%) and a specificity of 74.4% (95% CI: 57.9% to 87.0%). The C-statistic of follow-up ONSD/ETD was 0.804 (95% CI: 0.684 to 0.924). A cut-off > 6.46 had a sensitivity of 65.0% (95% CI: 40.8% to 84.6%) and a specificity of 87.2% (95% CI: 72.6% to 98.7%). However, there were similar predictive performances of ONSDs and ONSD indices for poor neurological outcome; the predictive performance of follow-up ONSD/ETD for poor neurological outcome was not significantly different compared to that of initial ONSDmax or follow-up ONSDaverage (p=0.199 and p=0.156, respectively).
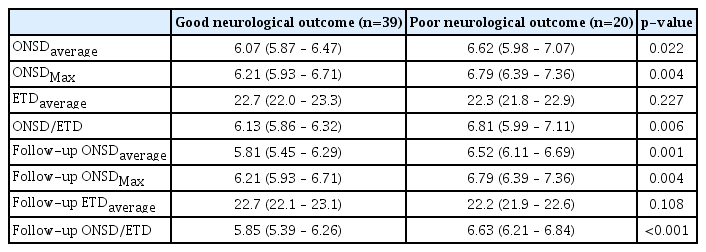
The optic nerve sheath diameters and their modifications according to neurological outcomes
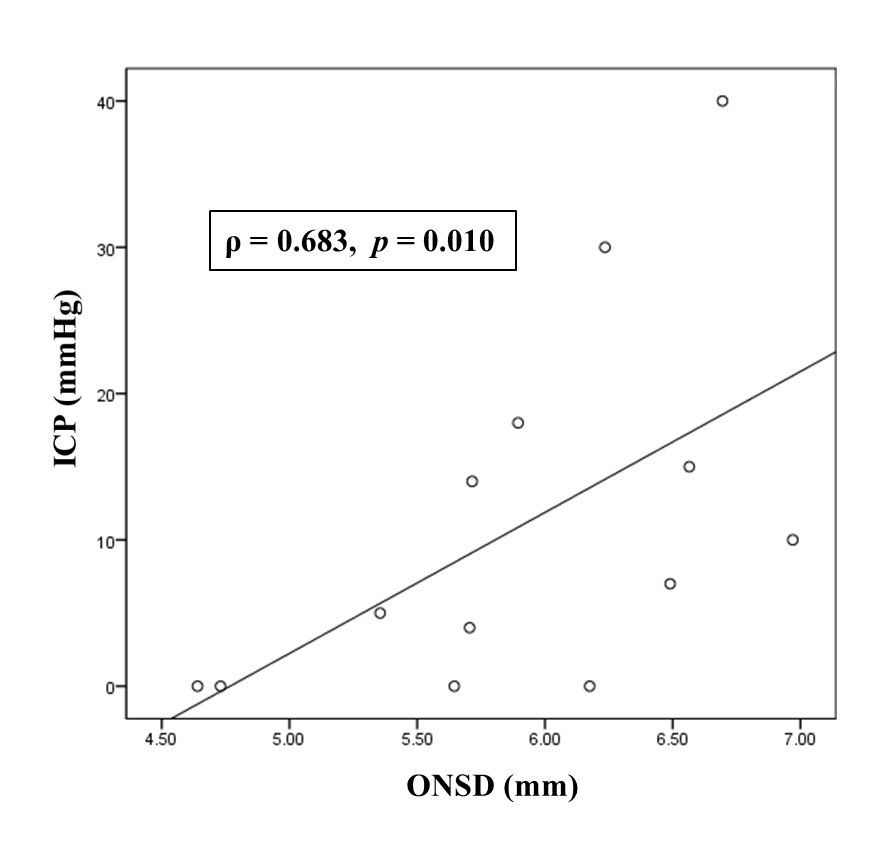
Scatter plot of intracranial pressure (ICP, mmHg) and optic nerve sheath diameter (ONSD, mm). Follow-up ONSDaverage was used in simple correlation analysis.

Receiver operating characteristic (ROC) curves for the prediction of poor outcomes using the optic nerve sheath diameters and their modifications. ONSD : optic nerve sheath diameter, ETD : eyeball transverse diameter.
DISCUSSION
In this study, we evaluated if the ONSDs and their modifications could be used to predict neurological outcomes of patients with poor-grade SAH. Major findings of this study were as follows: 1) the patients with poor-grade SAH had considerable survival rate (79.7%) and favorable neurological prognosis (66.1%); 2) Simultaneous measurement of ONSD on CT and ICP were moderately correlated; 3) In initial CT and follow-up CT, ONSDs and ONSD indices of the poor neurological outcome group were significantly greater than those of the good neurological outcome group and these markers could be used to predict neurological outcomes of patients with poor-grade SAH.
Although it is difficult to predict the outcome following SAH, level of consciousness on admission would be associated with prognosis of SAH patients2,6,13). One widely accepted predictor is the WFNS grade based on the level of consciousness as assessed by the Glasgow coma scale13,14). Especially, patients with poor WFNS grade SAH 4 and 5 historically have had high mortality and poor neurological outcomes13). However, in recent years, a considerable number of patients with poor-grade SAH treated aggressively with early coil embolization and supportive neurointensive care could achieve a favorable neurological outcome and survival6,13). Therefore, to accurately evaluate the prognosis of patients with poor-grade SAH, other predictors other than the initial level of consciousness are needed.
In patients with poor-grade SAH, poor neurological outcome is usually secondary to early brain injury or delayed cerebral ischemia2). Secondary cerebral injury can occur, that is the additive cerebral injury characterized by an imbalance in post-resuscitation cerebral oxygen delivery and use, ultimately culminating in neuronal death5). In addition, cerebral autoregulation may be disturbed to different extents and disturbed autoregulation in SAH is associated with delayed cerebral ischemia, vasospasm and unfavorable outcome5). Especially, uncontrolled intracranial hypertension results in decreased cerebral blood flow and transient global cerebral ischemia and associated with early brain injury and poor neurological outcome2,5). Therefore, early monitoring of intracranial hypertension may be beneficial in predicting neurological outcomes of the patients with poor-grade SAH.
Measurement of ONSD has been proposed as an alternative method for the detection of increased intracranial pressure4). The optic nerve is surrounded by cerebrospinal fluid because it is a part of the central nervous system. Therefore, increased intracranial pressure will be transmitted through the subarachnoid space surrounding the optic nerve, within the nerve sheath, especially the retrobulbar segment, unless circulation of cerebrospinal fluid is not blocked4). ONSD on initial brain CT may be correlated with neurologic outcomes after traumatic brain injury11,12). Simultaneous measurement of ONSD on initial CT and intracranial pressure were correlated, and ONSD was indicative of intracranial hypertension in patients with severe traumatic brain injury11,12). In this study, ONSD measured on CT scanning may be also a good predictive marker associated with intracranial pressure and prognosis in patient with poor-grade SAH.
This study has several limitations. First, it was a retrospective review of medical records. Therefore, the GOS was also retrospectively determined based on medical records. Second, the non-randomized nature of the registry data may have resulted in selection bias. Although brain CT scans were performed within 48 hours after SAH, a major limitation of this study may be that the CT scans were performed at different time settings. Third, invasive ICP monitoring was performed in a limited number of patients after aneurysmal treatment. Finally, our study was conducted at one institution and involved a lesser number of subjects. Although there were no significant differences between ONSDs and their modifications in this study, there may be different outcomes in larger cohorts. Therefore, future studies with larger cohorts are needed to validate these findings.
CONCLUSION
The ONSDs and ONSD indices measured on CT scanning may be used to predict neurological outcomes of patients with poor-grade SAH.
Notes
No potential conflict of interest relevant to this article was reported.
INFORMED CONSENT
Informed consent was obtained from all individual participants included in this study.